
You probably check your car’s tire pressure and oil level occasionally; most drivers have learned that under-inflated tires can cause poor performance and loss of control, and low oil can damage the engine. So why do so many marketers fail to take the same precautions with their databases? Maybe it’s because they don’t know why it’s important, or how to do it right.
Why Data Analysis Matters
In a recent post, Gaea Connary talked about the high costs of dirty data. Because your database is primarily used to filter or segment your contacts, and is heavily utilized for so many programs, that data needs to be captured and managed correctly. As Gaea showed, if it’s not in great condition, you won’t get great results. You need to look at:
- Standardization: How standard is the data in your picklist fields?
- Recency: When was the last time a heavily utilized segment field was actually populated?
- Accuracy: United States or Untied States?
Projects that particularly need the benefit of this effort include:
- Lead scoring: you need to clean up lead scoring variables for accurate results
- Segmentation: for nurtures, or special sales programs
- Additional data capture: making room for new data fields
- Migration: migrating from one CRM to another or one MA to another
- Efficiency improvements
Quite often, we’re asked to help clients clean up their fields because most of these systems have a maximum capacity like 250 fields, and a new program or division needs fields! When you actually look through, you can almost always find fields that are not being used, that can be deleted.
Get the Facts
At DemandGen we recommend that you analyze all the CRM and marketing automation data, to ensure that key objects are being standardized and populated accurately,
and then establish a routine for performing this type of analysis on a regular basis going forward.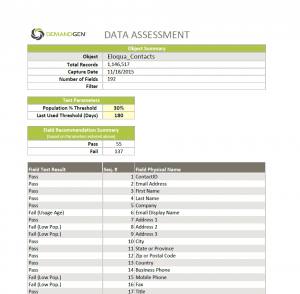
DemandGen approaches this type of analysis in a field-by-field fashion. We would look at each field and examine, for example:
- The number of unique values this field has
- The frequency that this field is populated
- The most recent time this field was populated
These are just a few examples, but an in-depth audit is sure to uncover a variety of issues. In fact, the first time it’s done, most people are shocked to see that the data looks a lot worse than they had anticipated!
Delve Deeper: Root Cause Analysis
Root cause analysis will solve the mystery of WHY this is data getting dirty. If your field has 100 values, maybe you are not providing a picklist when you should. If the last time this field was populated was months ago, maybe whatever is populating it is broken.
Some data sleuthing will uncover the source of problems. Country value is a good example: you’ll see “United States” represented many different ways. Why are you getting “Untied” States? Ah: it’s a list upload, the source is wrong, or a bad copy-and-paste-exercise. Another one is company size: How on earth does “February 9” get into a field for company size? Well, typically that’s shown as range for number of employees like 2-9, 1-11, etc. If this data is in a spreadsheet program first, “2-9” gets converted to February 9. When this kind of error gets out of hand it can wreak havoc on programs and segmentation. So it’s important to assess the status of the database again, in six months or so, to ensure the revised processes are working properly.
Reach Out for Help
Cleansing the current data, resolving problems with the population process, and standardizing where appropriate is really a relatively easy thing to do. But we’re often talking about huge volumes of data, and you may not have the bandwidth in-house to take that on. That’s where DemandGen can help; give us a shout.
____
 Rick Segura, Data & Insights Technical Specialist at DemandGen, is a vastly experienced data guru. Having 20+ years of database experience, Rick is a master of ETL (data processing), data merging & aggregation, report & dashboard development, data analysis and automation. He is very passionate about delivering intuitive, purposeful data-based solutions. and enjoys developing Excel reports/dashboards that feel more like interactive applications rather than simple-looking collections of tables and charts. Other articles by Rick Segura: Marketing Metrics Magic: Should you automate reports or implement a dashboard?
The post Keep Your Data in Check: Routinely Analyze your CRM and MAP Data Objects appeared first on DemandGen.


